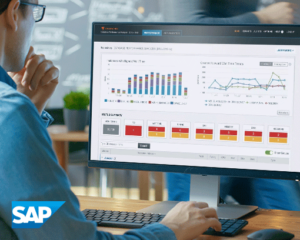

SAP HANA performance comes from deliberate architectural choices. It keeps active data in memory, relies heavily on columnar storage, and supports transactional and analytical workloads on the same platform.
Understanding those choices helps explain why SAP HANA can be fast, why sizing and query design matter, and why architecture-aware monitoring is important in production.
In this blog, Owen Murphy explores how to investigate application slowdowns by connecting distributed traces to database queries. When an application slows down, the first alert is only the beginning of the investigation. The real challenge is determining whether the delay comes from the application, infrastructure, network, or database—and finding the evidence to prove it.
Distributed tracing can show where a request spends its time, while database observability reveals what is happening inside the query itself. Together, they help teams connect application latency to database behavior and move from a vague performance symptom to a focused root-cause investigation.
Register for our live SolarWinds webinars on database alerts, SAP HANA troubleshooting, portfolio updates, and app-to-database tracing.
Learn how to prioritize SAP HANA query tuning, resolve blocking, and validate performance improvements with SolarWinds Database Performance Analyzer.
SAP HANA slowdowns are easy to misread when teams start with infrastructure symptoms alone. Learn how wait-based analysis can help database teams identify where delay is building, what changed, and which SQL, blocking, plan, or resource context matters most.
In this post, Eoin Keenan breaks down the SolarWinds Database Portfolio May 2026 Product Update and explains what the latest product release means for database teams.
In this post by Eoin Keenan, we look at a specific source of database risk most teams overlook: unmonitored, “shadow” database instances that never make it into your database monitoring tools. These “temporary” databases often run in production for months without patches, security controls, or performance visibility.
In the first part of this series, we established that successful AI adoption in database performance hinges on strong foundations. The most effective teams use a common framework for their database operations: monitor for a single, unified view; diagnose by cleaning signals with baselines and anomaly detection; optimize proactively to build durable resilience; and ensure these practices work everywhere across hybrid and multi-vendor environments.