

The alert fires on p95 latency. A high-traffic API endpoint whose p95 normally sits under 100ms is now sitting at 380ms at the 95th percentile. That’s not right. You go through your initial checks.
No errors. No recent deployments. No infrastructure alerts firing anywhere in the stack.
This is the hardest kind of incident to open. Without an error or a change event to anchor on, the alert alone doesn’t tell you which layer is responsible. You need to look at the traces, specifically at what happened inside the requests that were slow.
How Distributed Tracing Separates Application Work From Database Work
A distributed trace is a tree of spans. Each span represents one unit of work: a service handling a request, an outbound HTTP call, a database query, etc. A shared trace ID links the spans, and each span carries timing data (when it started and how long it took).
Database spans are distinguishable from service spans by their metadata. OpenTelemetry semantic conventions define a standard set of attributes for database spans. For example:
- db.system: what kind of database was called
- db.statement: what query was sent
- span.kind (sw.span_kind in SolarWinds Observability SaaS): whether the caller is acting as a client or server
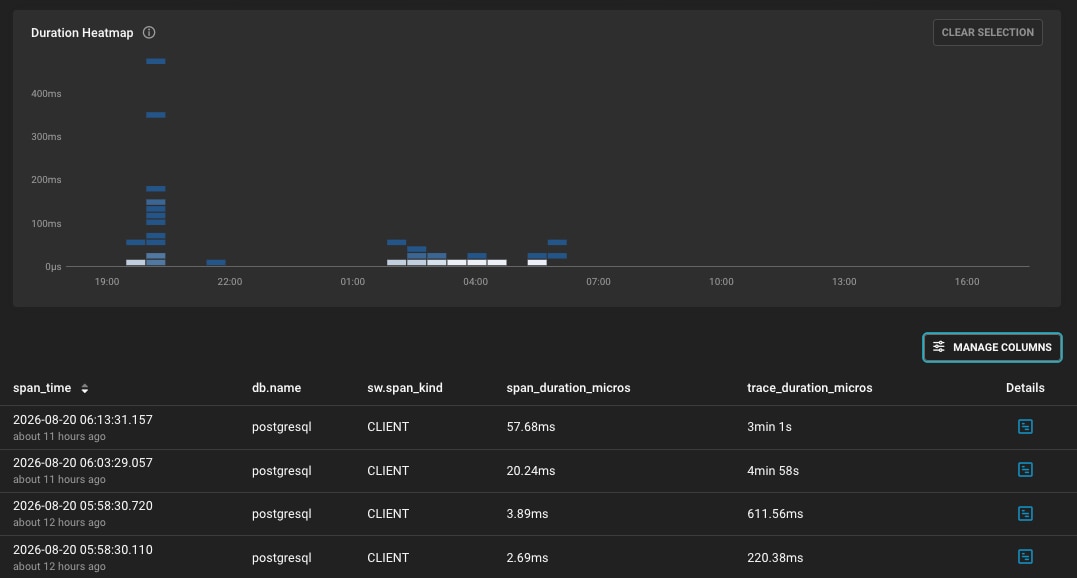
- span.kind = CLIENT means this timing is measured from the application’s side, covering the full round-trip to the database and back.
The span duration becomes your latency budget. If the total trace duration is 380ms, and the DB span is 340ms, then the database consumed roughly 89% of the request time. That’s the number that turns a suspicion into a claim worth investigating.
There’s one more detail to understand before you get into the tooling. When SolarWinds® Observability SaaS APM instruments an application, it can inject trace context directly into outgoing SQL queries as a comment. This shows up formatted like /*traceparent=’00-e65e156d…-01’*/. That comment travels with the query to the database server, where the DBO Agent reads it. This is what allows SolarWinds Observability SaaS to link an APM trace to a specific query execution in DBO. The trace connects the slow call to the matching database evidence.
Finding the Slow Span in SWO APM
Start in the APM service dashboard.
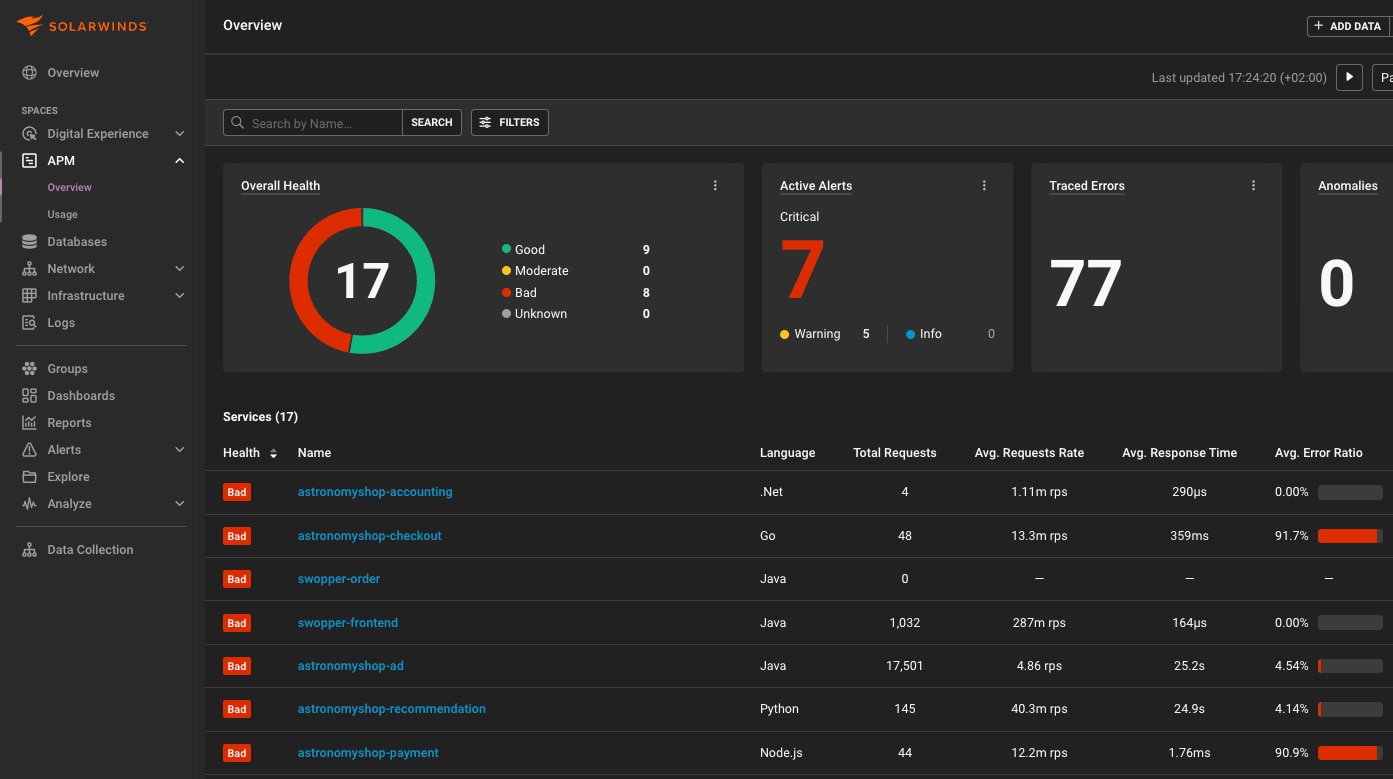
The response time trend confirms the latency spike started a few hours ago. Throughput is flat, so this isn’t a traffic surge simply pushing the service past capacity. The slowdown has been happening even though the request rate has been typical.
From here, navigate into the offending service, and open the Traces tab. Sort by duration.
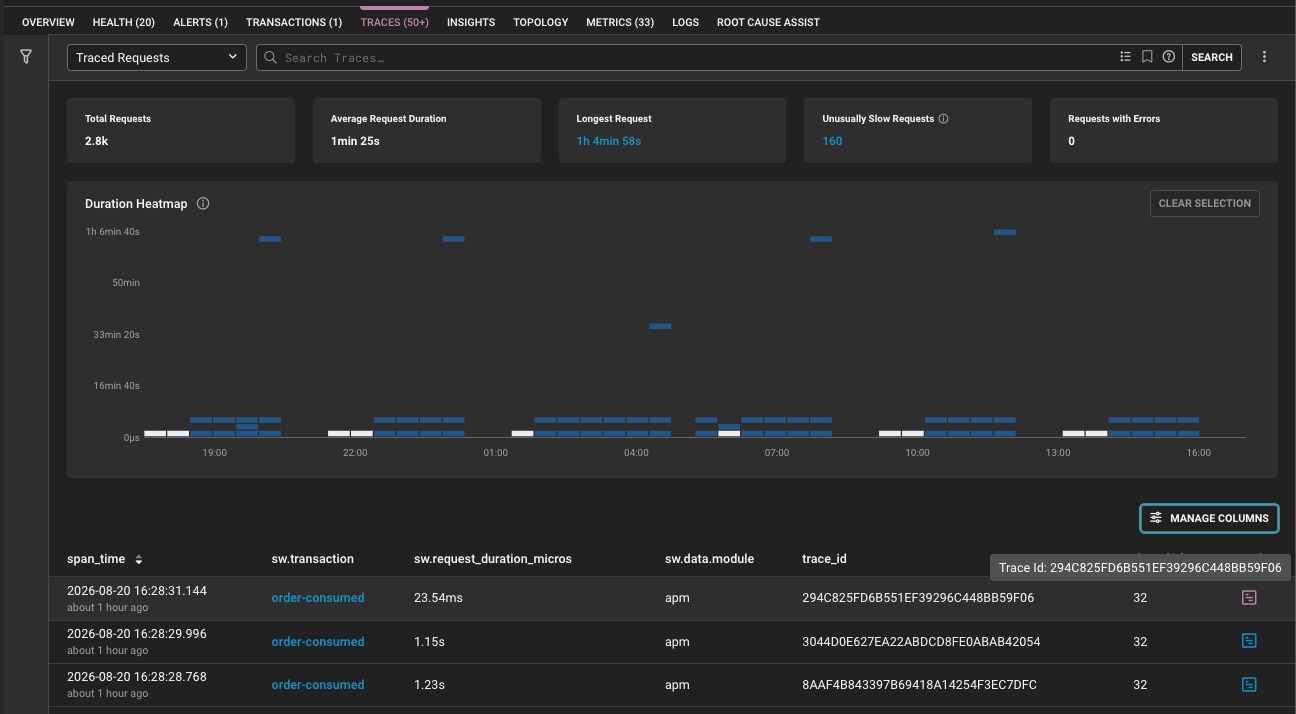
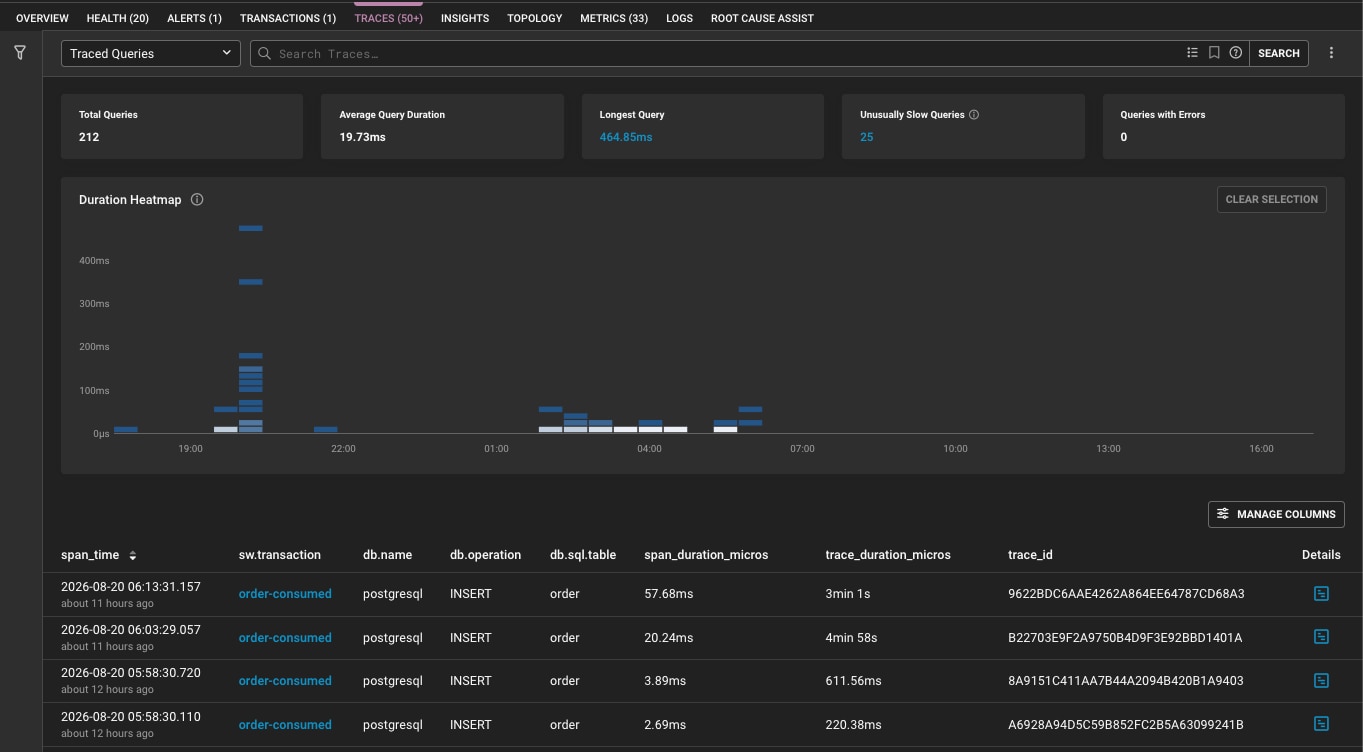
The slow traces cluster at the top, all sharing the same shape. Select one and open the Trace Details.
The Waterfall view makes the problem visible immediately. There’s a single DB span that dominates the duration, and everything else in the trace is noise by comparison. The Execution Breakdown view puts a number on it: the application code accounts for a small fraction of the total duration. The database call is where the time is going.
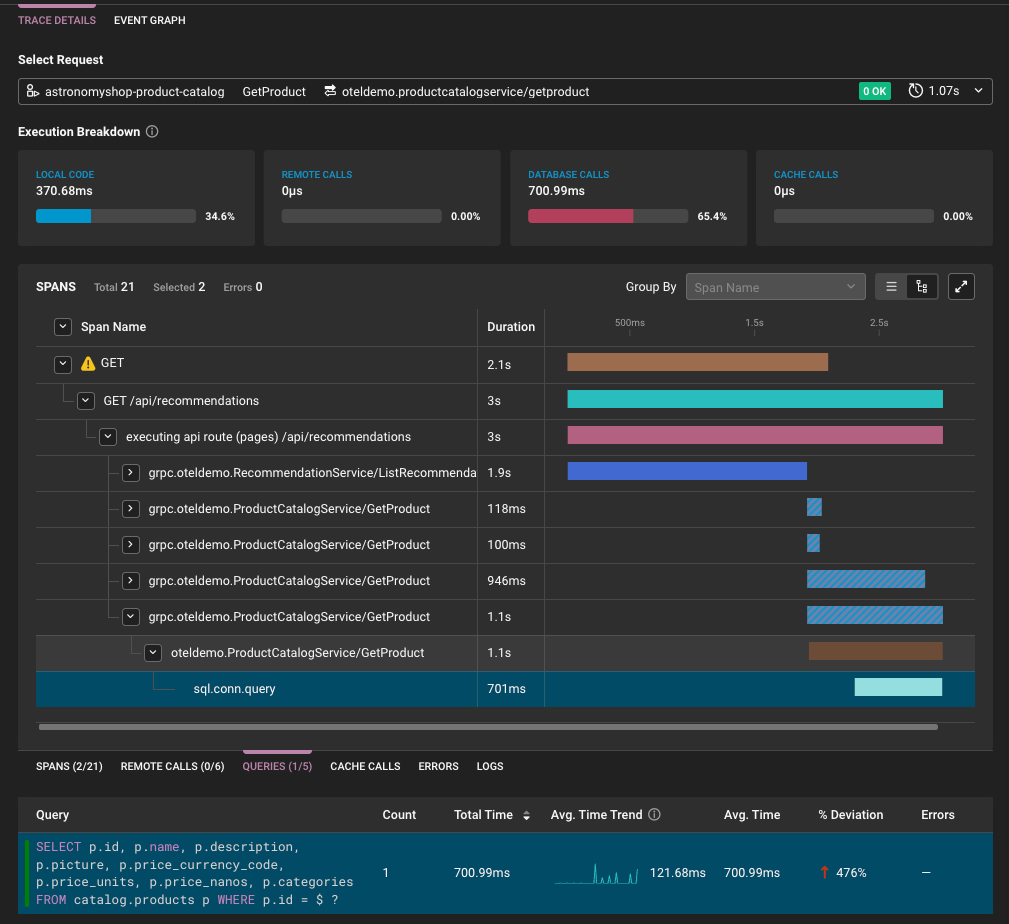
The span metadata on that slow DB span identifies the query. The Span Details panel also shows a Query Response Time chart, which compares the span duration (measured client-side by APM) against the query execution time collected by DBO. If the two track closely together, that’s an early signal that the database itself is responsible for the latency increase, not network overhead or application-side delays.
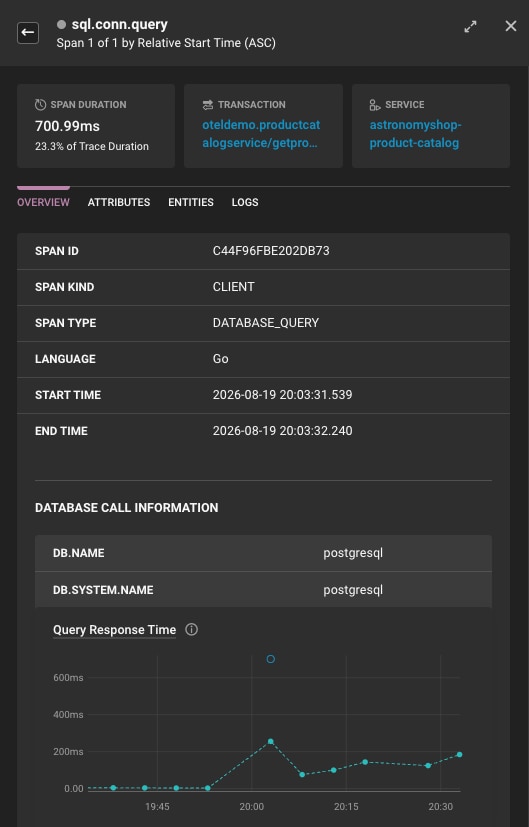
At this point, the database call is the strongest lead in the investigation. The trace shows where most of the time is being spent, but you still need database-side evidence to explain why that call became slow.
Pivoting Into DBO
The traceparent comment is the bridge, and links the two views. Because the APM instrumentation injected that comment into the query before it was sent to the database, the DBO Agent captured it along with the query sample. From the slow span in Traces Explorer, you can jump straight into DBO and continue the investigation.
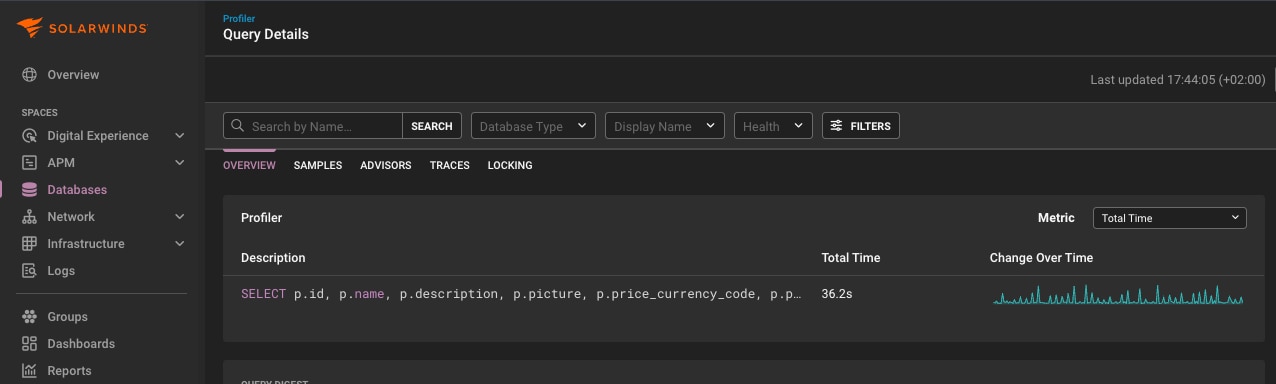
When you follow that link, the perspective shifts.
- APM shows client-side round-trip time: from the moment the application opened the database connection to the moment it received a response.
- DBO shows server-side execution time: what the database actually spent executing the query, independent of network latency and connection overhead.
The two numbers will be close but not identical. If the two timings are close, that strengthens the case that the database engine is a major contributor to the slowdown. If there is a larger gap, that points to additional overhead outside the database execution itself and should be investigated further.
Diagnosing the Query in DBO
The DBO Profiler ranks queries by resource consumption and execution frequency.
The query family from the slow APM span appears near the top. Cross-reference the query digest from the APM span metadata against what the Profiler shows to confirm you’re looking at the same query.
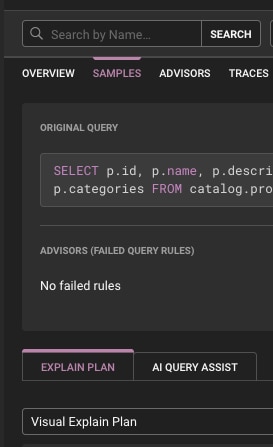
Move into the Samples tab for that query.
This is where you see what the database actually ran: the raw query text, server-side execution time per sample, and rows examined. Look at the distribution across recent samples. Consistent slowness across all of them points to a query or plan problem rather than resource contention from a noisy neighbor.
The Explain Plan tab for the query is where the root cause surfaces.
If execution-plan history is available for the query and environment, compare recent and earlier plans to test whether execution behavior changed during the incident window. A plan change would be one plausible explanation to investigate alongside statistics drift, data growth, parameter sensitivity, blocking, or broader resource pressure.
No deployment triggered this. One possible explanation is that changes in table statistics or data distribution influenced the planner’s decision. But that should be tested against other likely causes before drawing a conclusion.
Proving the Database Is the Problem
As you put together your assessment, you track down the numbers that close the case:
- Total trace duration: 380ms
- DB span duration (client-side, from APM): 340ms (89% of request time)
- Server-side execution time (from DBO samples): ~310ms
- Remaining delta (~30ms): network and connection overhead
The application code’s contribution to total latency is around 40ms, which is within normal baseline. There’s no evidence of memory pressure, garbage collection pauses, or thread contention in the APM service metrics. The database host shows elevated I/O, but that’s a consequence of the sequential scan, not an independent cause.
The database is the problem. The specific problem is a planner regression on a single query family.
The Handoff
At this point you have everything needed to hand this off to your database team. Your evidence package looks like this:
- Trace ID from the slow request that opened the investigation
- Query digest identifying the affected query family
- Affected endpoint and its p95 trend over the past 72 hours
- DB span duration: 340ms client-side, with ~310ms server-side
- Plan regression timeline: index scan until approximately [date], sequential scan observed from [date] onward
- Suggested starting point: run ANALYZE on the target table to refresh planner statistics; evaluate whether the index needs updating for current data volume
This is what integrated APM and DBO observability gets you: not just knowing that an API is slow, but being able to pinpoint which query caused it, when the behavior changed, and what your database team should look at first.
When APM context and database evidence can be correlated successfully, teams get a much clearer chain from endpoint latency to the database behavior worth investigating next.
Tracing Application Latency to Database Queries FAQ
What does APM-to-DBO integration conect?
It connects an application trace to the database query execution it initiated. APM provides the client-side view of the request and database-call duration, while DBO provides database-side query samples and performance context. When correlation is available, you can navigate between trace details and the relevant query or query sample.
How is the trace linked to the SQL query?
The APM instrumentation library can inject OpenTelemetry trace context into the SQL query as a comment, such as /*traceparent=’00-…-01’*/. The DBO Agent processes that context to establish the connection between the trace and the database evidence.
Why might a slow trace not link to a DBO query?
A link may be unavailable if the trace has not yet been processed, was not sampled, the query has not yet been sampled by DBO, or trace-context injection was not configured correctly. Infrequently executed queries may take hours to receive DBO links.
Does trace context work with every database query?
No. Support varies by language, database type, driver, and framework. In several implementations, trace context is not inserted into server-side prepared statements or stored procedures.
If APM and DBO timings are close, does that prove the database caused the incident?
It is strong evidence that database execution is a significant contributor, but it is not proof on its own. Compare the server-side execution time with client-side span duration, then validate the explanation with query samples, plan history where available, blocking indicators, and resource conditions.
What should the database handoff include?
Include the trace ID, endpoint and latency trend, query digest, client-side DB-span duration, server-side DBO timing, relevant query samples, and any evidence of a changed execution plan. Frame hypotheses—such as stale statistics, data-distribution changes, parameter sensitivity, or resource contention—as items to test rather than confirmed root causes.
How can I troubleshoot missing correlation?
On the DBO side, inspect query sample details for the injected trace-context comment and filter queries using traceparent. To verify server-side spans, navigate from a query sample to trace details and look for DBO events in the event graph.
Where can I see the integration requirements?
Review the APM and DBO integration documentation for supported libraries, setup requirements, and troubleshooting guidance.
How can I explore SolarWinds Observability SaaS?
Request a demo through the SolarWinds Observability SaaS demo page. The page describes a fully functional 30-day experience.