In a high-pressure production outage, the primary enemy isn’t just database latency. It’s the clock.
Historically, teams have struggled to diagnose performance regressions in distributed environments because navigation friction slows every step. When an SRE or DBA jumps between disparate screens, correlates disconnected telemetry, and filters through irrelevant noise, cognitive load rises fast. As a result, Mean Time to Detection (MTTD) grows, and Mean Time to Remediation (MTTR) often follows.
The solution is not more data. Instead, it is better context. That’s why we overhauled the SolarWinds Database Observability (DBO) SaaS experience to deliver a faster, more intuitive interface that aligns database health with the broader full-stack telemetry of the SolarWinds Observability platform.
Key Benefits: Reducing the Time to Insight
-
Unified signal prioritization: The new visual hierarchy helps teams spot high-risk performance issues quickly, so engineers can focus on the signal instead of the noise.
-
Context-rich drill-downs: We reduced the clicks required to move from a high-level health view to query-level detail.
-
Reduced cognitive load: By simplifying workflows and standardizing the UI across the SaaS platform, teams can keep their mental context while they pivot between database, infrastructure, and application layers.
-
Accelerated TTV (Time to Value): Simplified onboarding and streamlined navigation help new users identify database hot spots within minutes of deployment.
The Workflow: From Detection to Resolution
The new UX supports a top-down investigative workflow.
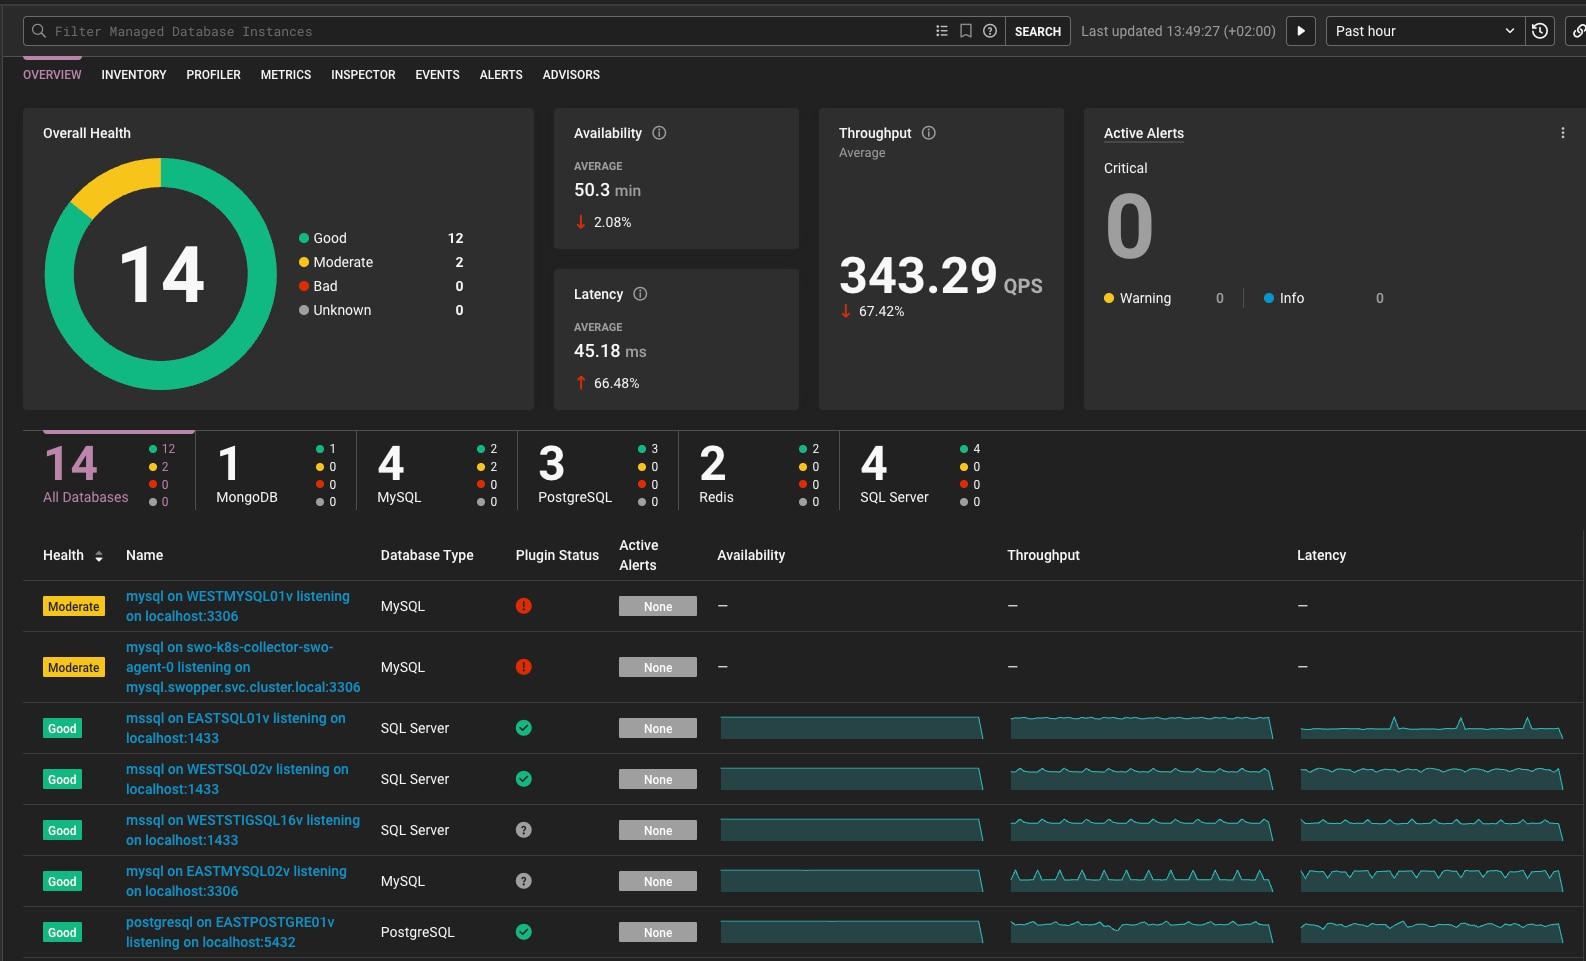
Observe: First, navigate to the DBO Landing page to review overall database health. At-a-glance indicators help teams identify instances that need attention, while anomalies contribute to the overall health state rather than appearing as a separate landing-page view.
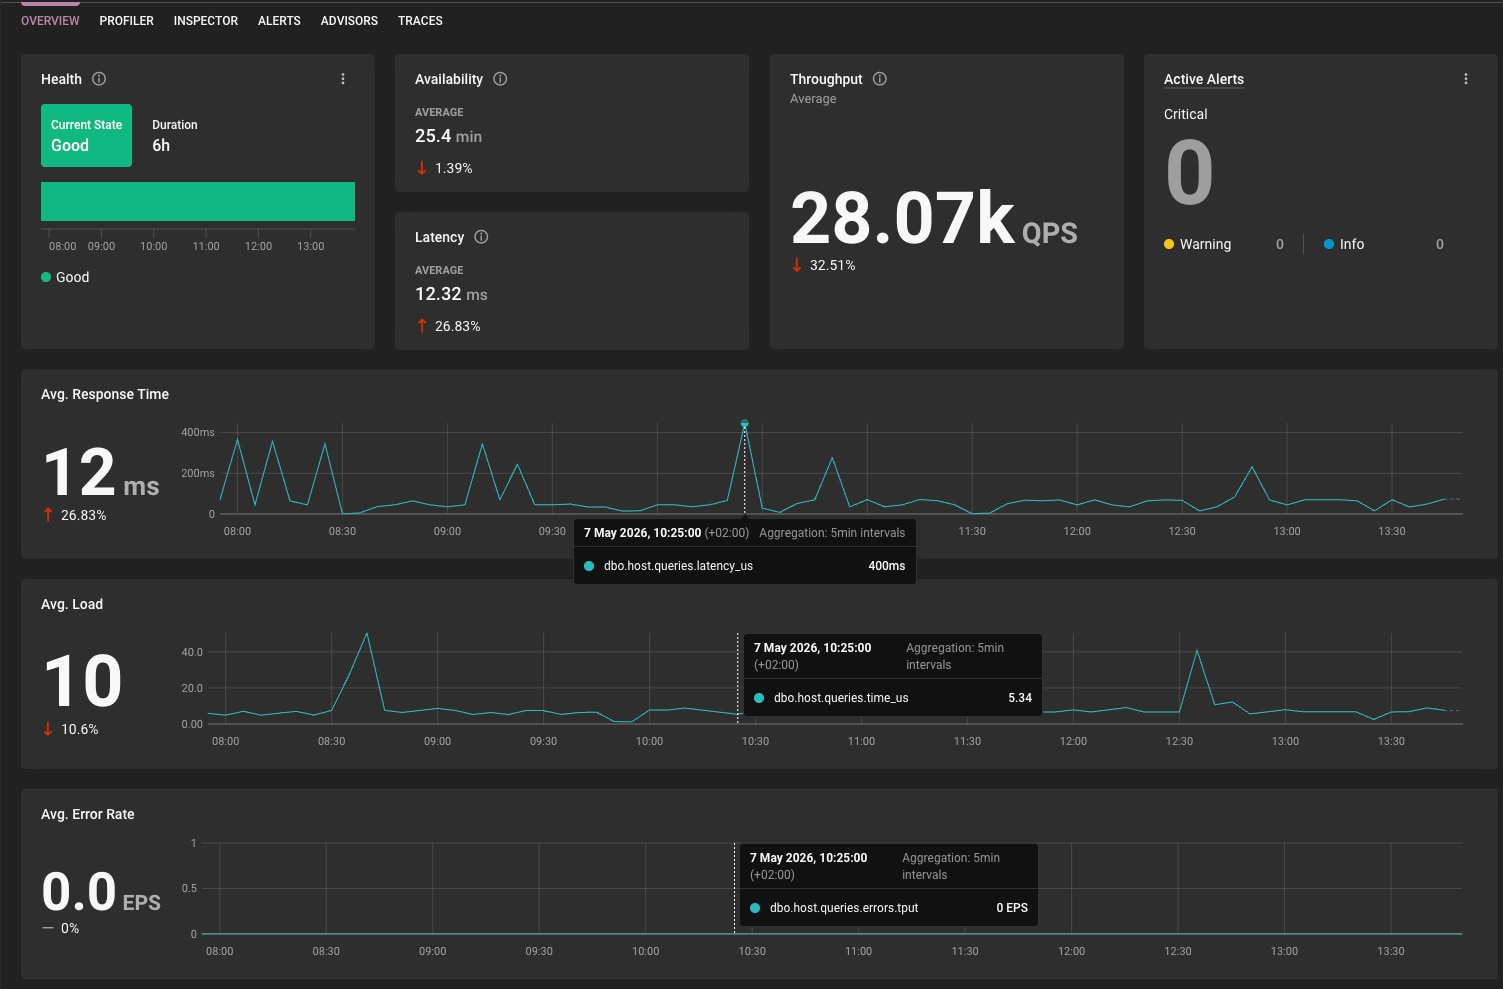
Analyze: Next, select a distressed instance to enter the DB Instance overview page. This dedicated page for the selected database instance makes performance data easier to review and keeps the investigation in context.
Drill down: Then, use the time selector to isolate a latency spike. The UI updates the surrounding performance context, so you can focus on what happened during that window.
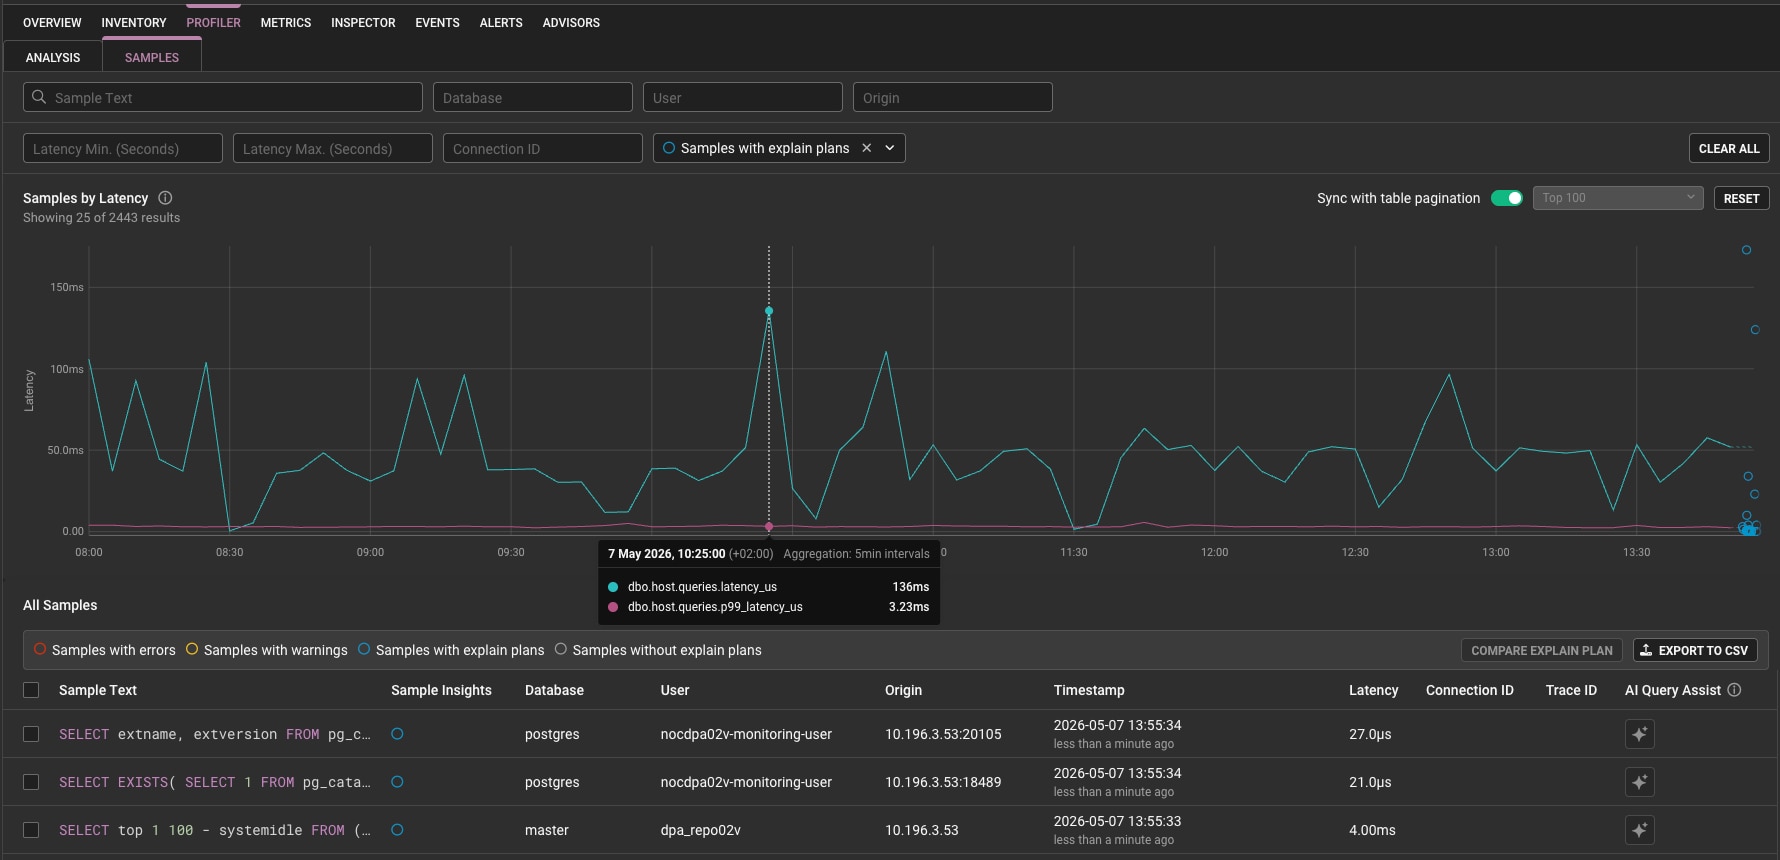
Remediate: Finally, click into a specific query to review the Query Detail page. Here, the updated layout helps teams prioritize execution details and potential optimizations so they can act faster.
Impact Across the Team
For the DBA: This means less time driving the tool and more time performing high-value architectural tuning. In particular, the UX improvements target the click fatigue that often comes with managing large-scale database fleets.
For the SRE or DevOps engineer: This creates a common language. Because the DBO UX now aligns more closely with the rest of the SolarWinds Observability platform, cross-functional teams can collaborate on full-stack issues without becoming database specialists.
Conclusion
A modern database observability tool should stay out of your way. By reducing navigation friction and prioritizing actionable insight, the new UX in DBO SaaS helps teams move from “something is wrong” to “here is the fix” faster.
Get started today by visiting the SolarWinds Observability documentation.
FAQ
1. Why does database observability need to reduce time to insight during an outage?
In a high-pressure production outage, the primary enemy is not just database latency. It is the clock. When teams jump between disparate screens, correlate disconnected telemetry, and filter through irrelevant noise, cognitive load rises fast. As a result, Mean Time to Detection (MTTD) grows, and Mean Time to Remediation (MTTR) often follows.
2. What is the main goal of the new SolarWinds Database Observability SaaS experience?
The goal is not more data. It is better context. That is why the SolarWinds Database Observability SaaS experience was overhauled to deliver a faster, more intuitive interface that aligns database health with the broader full-stack telemetry of the SolarWinds Observability platform.
3. How does the new workflow help teams move from detection to resolution?
The new UX supports a top-down investigative workflow. Teams start on the DBO Landing page to review overall database health, select a distressed instance to enter the DB Instance overview page, use the time selector to isolate a latency spike, and then click into a specific query to review the Query Detail page. The updated layout helps teams prioritize execution details and potential optimizations so they can act faster.